Table of contents
Introduction
Abstract
In this dive into the beer world, our project seeks to figure out the subtle differences that various ways of serving—bottle, can, and draft—bring to beer reviews. We're curious about what makes people like one style over another. Why does it matter, you ask? Because beer enthusiasts, much like you and me, take their choices seriously. And we want to know if the container affects how they rate and describe the brew. By closely looking at a dataset of beer reviews, we want to spot any connections or trends that show how serving styles might sway the overall rating and what people say about the beer. As we take on this bubbly quest, we hope to quench the thirst for understanding how picking between a bottle, can, or draft might shape how beer lovers feel.
The Curiosity Spark
Picture this: A cozy pub, friends gathered, and the bartender presenting three options – a bottled beauty, a canned contender, and a freshly poured draft. Each sip tells a story, and we're here to decode it. What makes a person lean towards one style over another? Is it the tactile satisfaction of popping a cap, the convenience of a can, or the experience of a perfectly pulled pint?
Ok.. let's not drink our beers too fast, but rather try to answer these questions:
- Does a specific serving style consistently earn higher or lower ratings than its counterparts?
- Are certain beer types more closely linked to a particular serving style?
- Do regional preferences influence the choice of serving style in different corners of the globe or across the United States?
Unveiling the Data
Our dataset is drawn from Beer Advocate, a platform where beer aficionados share reviews. Users assess beers across aspects like aroma, taste, appearance, palate, and assign an overall grade. The dataset also includes key beer details—alcohol by volume, beer style, brewery, and its location. User information is limited to usernames and locations.
Beer Styles and ReviewsTo start, let's take a look at the distribution of beer styles and the number of reviews each beer has received.
The first image unveils the top 10 most common beer styles, providing insights into the variety within our dataset. The second image presents a histogram, showcasing the distribution of reviews per beer in a logarithmic scale.
It's interesting to notice how common american beer are in this dataset.
Breweries and LocationsMoving on, let's explore the brewery landscape and the most prevalent brewery locations.
Here, we delve into the brewery landscape, examining the distribution of beers per brewery and the top 10 locations where breweries thrive.
Unsurprisingly, Germany, renowned worldwide for its beer, emerges as the predominant brewery location. The United States of America takes the lead with an abundance of brewery locations, particularly when considering all states collectively. This observation suggests that Beer Advocate is predominantly utilized within the United States.
User Reviews and LocationsOur exploration wouldn't be complete without understanding the users behind the reviews. Let's unravel the story of reviews per user and the most common user locations.
In these images, we unveil the distribution of reviews per user and uncover the top 10 locations where our users hail from.
Confirming our earlier assumption, this plot indicates that the site hasn't significantly transcended the borders of the United States. While users from around the world contribute, Americans constitute the predominant user base. Let the exploration continue!
In order to analyse our dataset, we thought of grouping similar beers together. These groupings provide us with a more generalized view of beer styles, setting the stage for uncovering hidden patterns within each category. The categories can be explored here below - Please enjoy the interactive plot!- Let's proceed with our intriguing exploration!
But wait, we've got a missing ingredient in our analysis – the serving style!
Indeed, the serving style is not given in our dataset. So... how do we continue ?
Serving style extraction
The first step of our exploration to retrieve the serving style, was to look at the reviwes. Do user really specify a specific serving ? How do they phrase it?
To get a first intuition of this, we labelled by hand 250 reviews. More than discovering quirky reviews, we realised that unfortunately not all reviews present a serving style.
In our exploration of 250 hand-checked beer reviews, we set out to uncover the mysteries of serving types. We could not label all reviews by hand! We needed to come with an awesome technique to get the label - when there was any.
We kicked things off with the simple naïve method, choosing a serving type when the answer was obvious, i.e. the word "bottle", "can" or "draft" was found. But... What about when multiple serving types were mentioned? What about when the serving type was mentionned differently, using slang?
As the reviews got more complex, we tried the fancier similarity method, using NLP calculations to compare review text with potential serving types. To do this, we first came with a list of different words which could be assimilated to different serving style.
| Bottle | Can | Draft |
|---|---|---|
| bottle | can | tap |
| bottled | canned | on-tap |
| corked | tin | draught |
| capped | aluminum | draft |
| sealed | canister | tapped |
| brown | canned | pint |
| clear | crushable | pour |
| ring | keg | |
| metal | barrel | |
| cask | ||
| untapped | ||
| hand-Pulled |
Despite our efforts to enhance accuracy, the straightforward naïve method proved to be more effective overall. The accuracy decreased, and the number of reviews categorized as unknown increased. Subsequently, we decided not to pursue the similarity method further and continued refining the naïve method. We acknowledged its limitations, especially when dealing with ambiguous statements like the one found in some reviews: "I actually found this more elegant and less bruising than expected. Stone can still surprise," where the word "can" functioned as a verb, not a serving type, but our algorithm mistakenly considered it one.
To address such challenges, we introduced a rule-based method. This involved differentiating between the verb 'can' and the noun 'can' in the reviews and excluding serving types if certain verbs ("would," "could," "'d," "will") were present. For instance, in sentences like "and I will certainly be keeping an eye out for a bottle," the serving type 'bottle' wouldn't be considered because the user had not yet consumed from a bottle. Despite these efforts, challenges persisted, leading us to refine our approach further with a tense-based method.
In the Tense-based method, we focused solely on the unknown reviews identified in the rule-based analysis. The method involved analyzing the different tenses of the verbs before the serving type. When a verb in the past was found, the serving type was taken. However, if the verbs were all in the present, the serving was considered unknown. This allowed us to decrease the amount of unknown by 4%, giving us 100,000 more data while keeping the accuracy around 94%.
All these methods were applied by examining the 250 hand reviews and were modified to maximize accuracy. The journey from the simple naïve method to the more refined tense-based method underscores the complexities involved in recognizing serving types in reviews. Cheers to the adventure! 🍻
| Rule | Accuracy | Unknown | bottle | can | draft |
|---|---|---|---|---|---|
| naïve | 75.6% | 42.2% | 22.25% | 23.5% | 12% |
| similarity | 64% | 93.7% | 2.5% | 0.8% | 3.1% |
| rule-based | 94.4% | 59.6% | 29.1% | 2.1% | 9.3% |
| rule-based + tense | 94% | 55.6% | 31.5% | 2.5% | 10.4% |
Data Visualizations
Upon uncovering the serving style details for each review, we came to the realization that more than half of our initial dataset was lost due to unknown serving style. The current dataset may not be exactly the same as the original one. This is due to the fact that we discard some users who tend to never specify the serving style. This has led to a skewed distribution. However, we couldn't simply discard it. While our dataset may not be as comprehensive as before, it still holds valuable insights!
We embarked on a data exploration journey, uncovering hidden gems in our final dataset. Think of it as sifting through the beer-filled sands to find the real treasures of serving style – those data patterns!
Temporal Analysis
Our journey through time revealed interesting patterns:
Website popularity soared until 2011, but then? A dip. Probably the rise of smartphone apps – the new sheriffs in town!
December, a month of beer reviews. Winter solitude or just sipping on gifts? The mystery remains.
Geographical Analysis
Let's globetrot! After enriching our data with serving styles, we delved into global beer habits – or rather, what people sip their brews from.
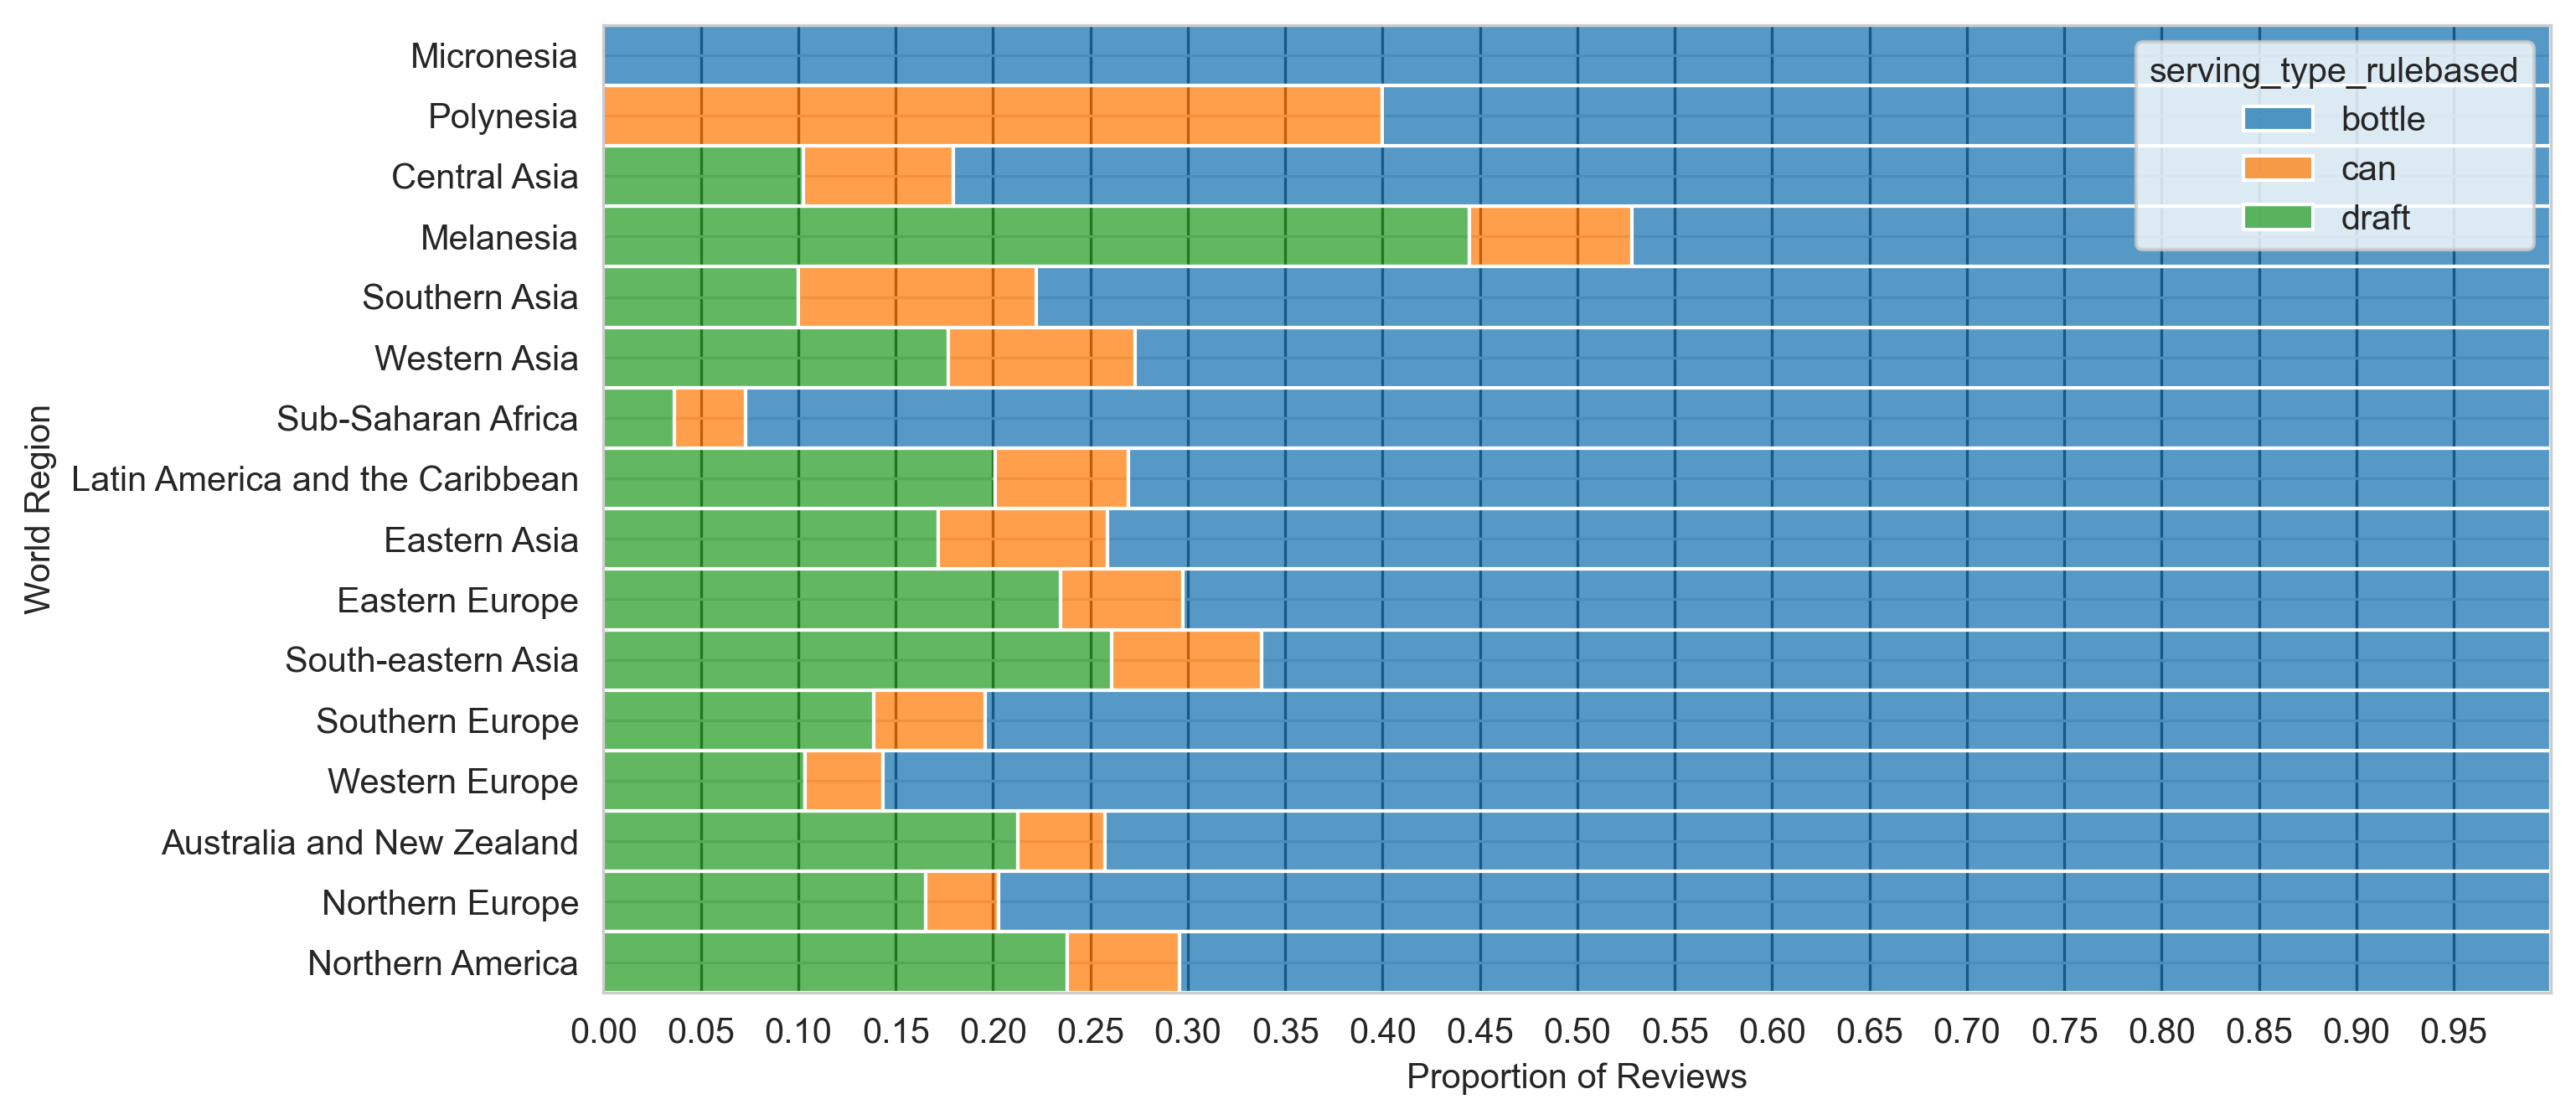
Regions show their style! Micronesia and Sub-Saharan Africa prefer bottles, while Melanesia leans towards cans. Rest of the world? They dance to the beat we predicted earlier.
What about the US ? How are the serving styles distributed across the country ? We decided to visualize the 10 states with the most reviews.
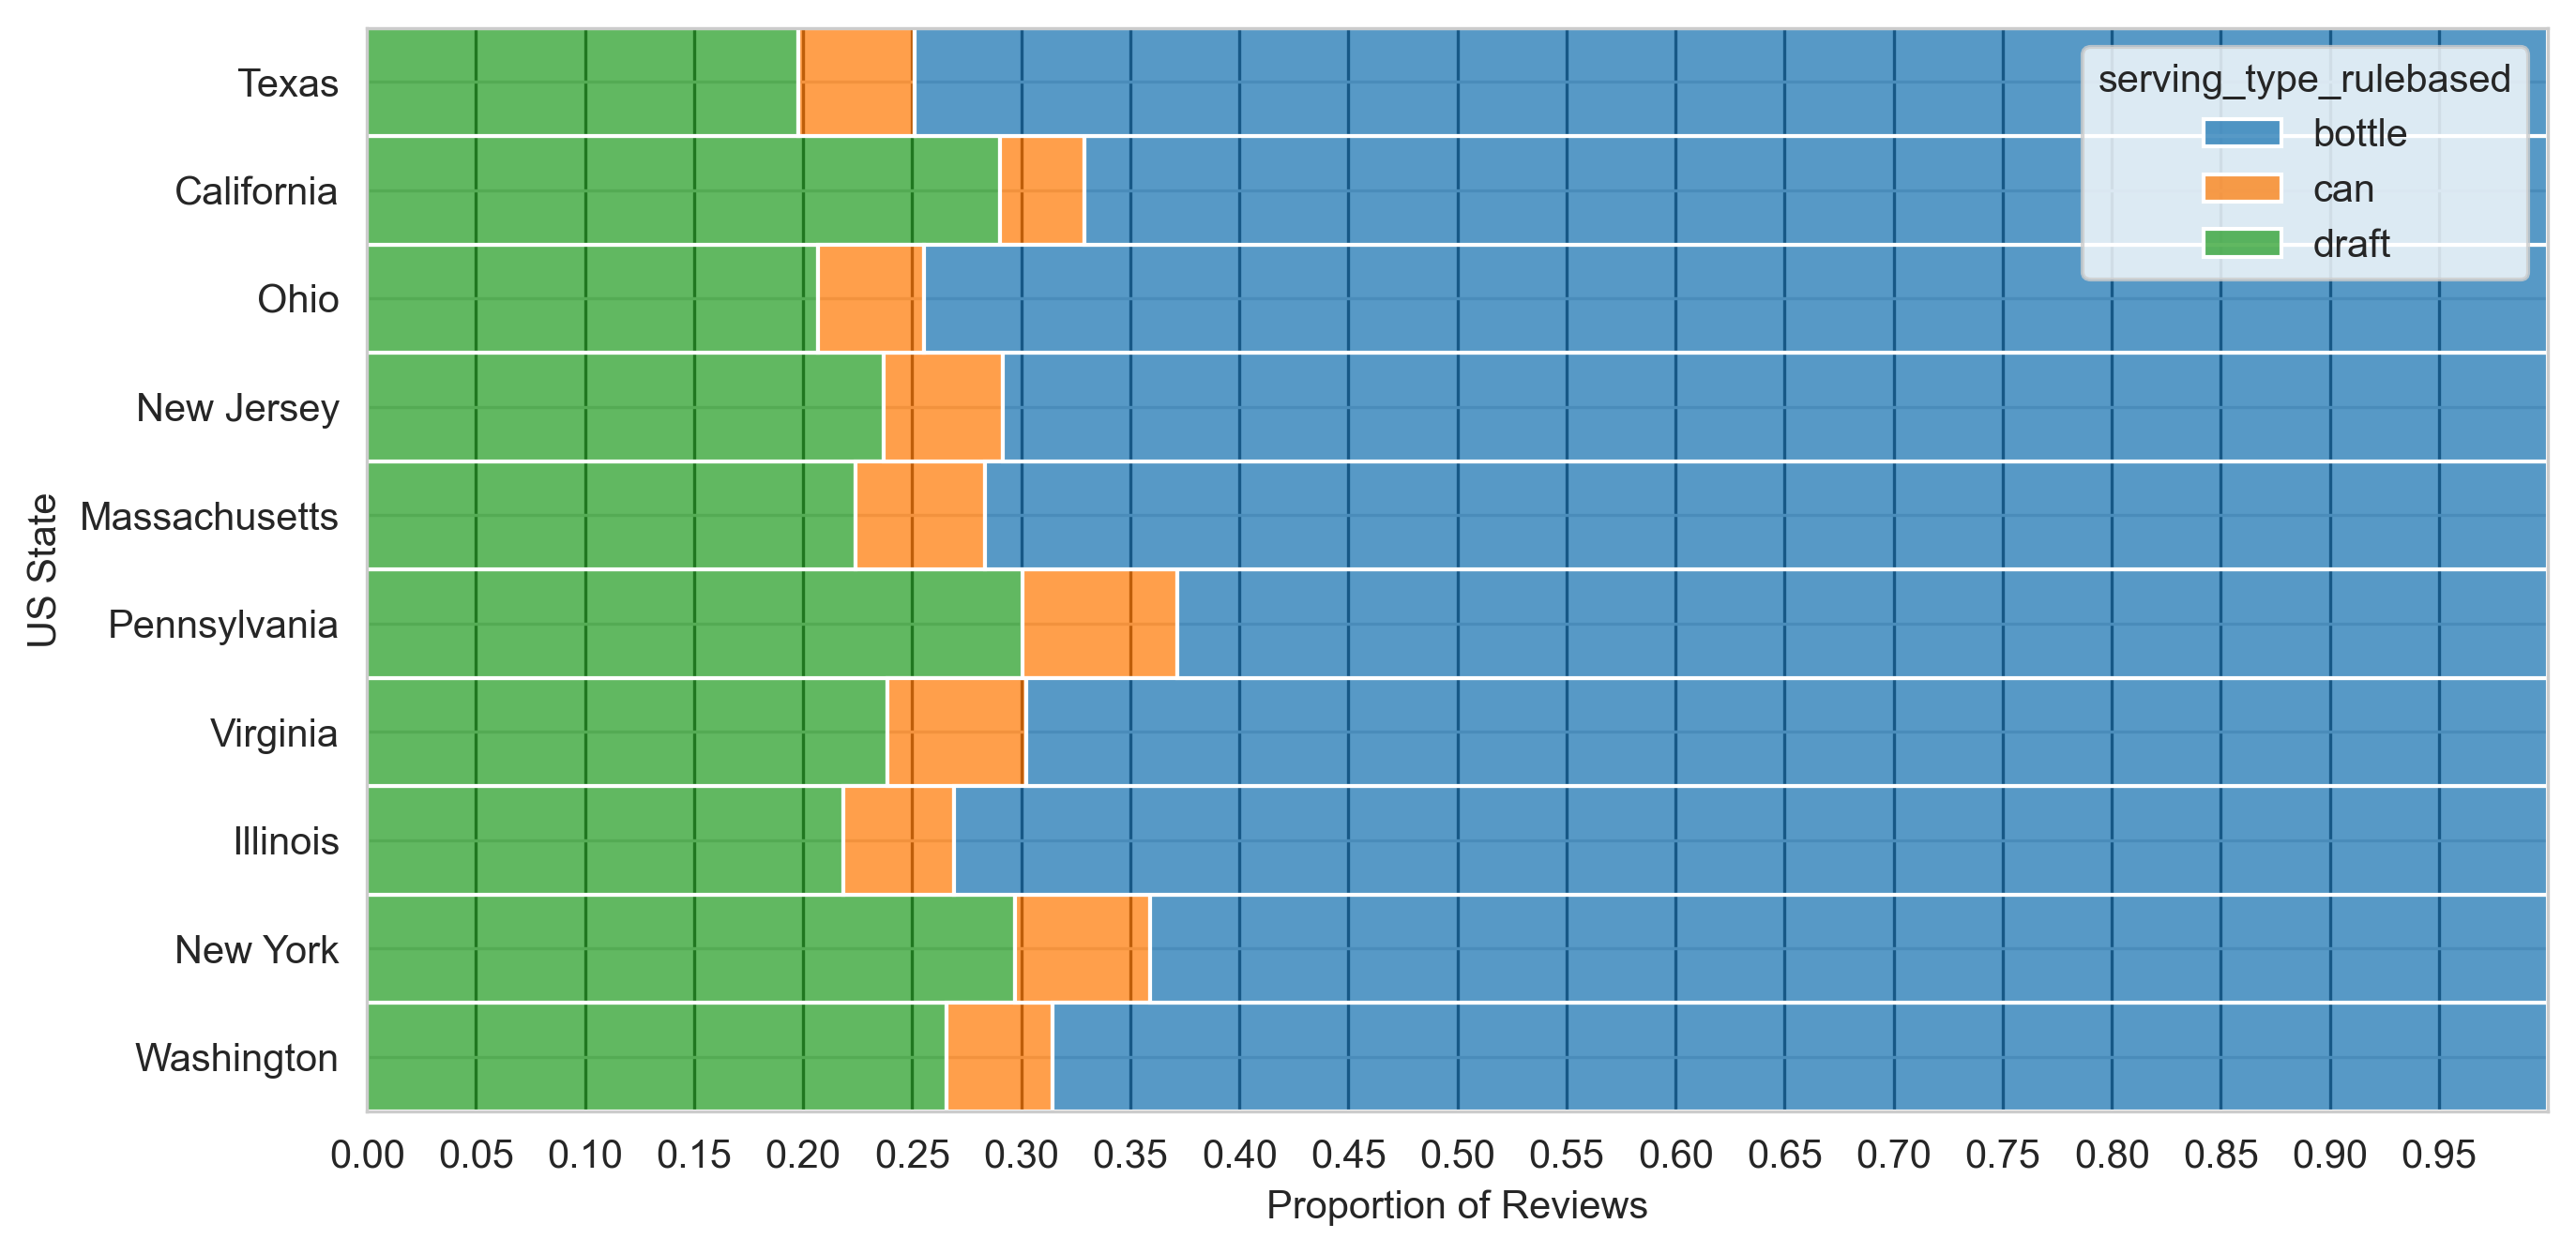
There seems to be less diversity in the US, with most states preferring bottles. Some states tend to drink more draft beers, like California or New York, but the proportion of canned beers is the same accros the country.
Categories of Group Analysis
Enter the beer group mystery! How do different styles cozy up to serving styles? We grouped styles, seeking the patterns.
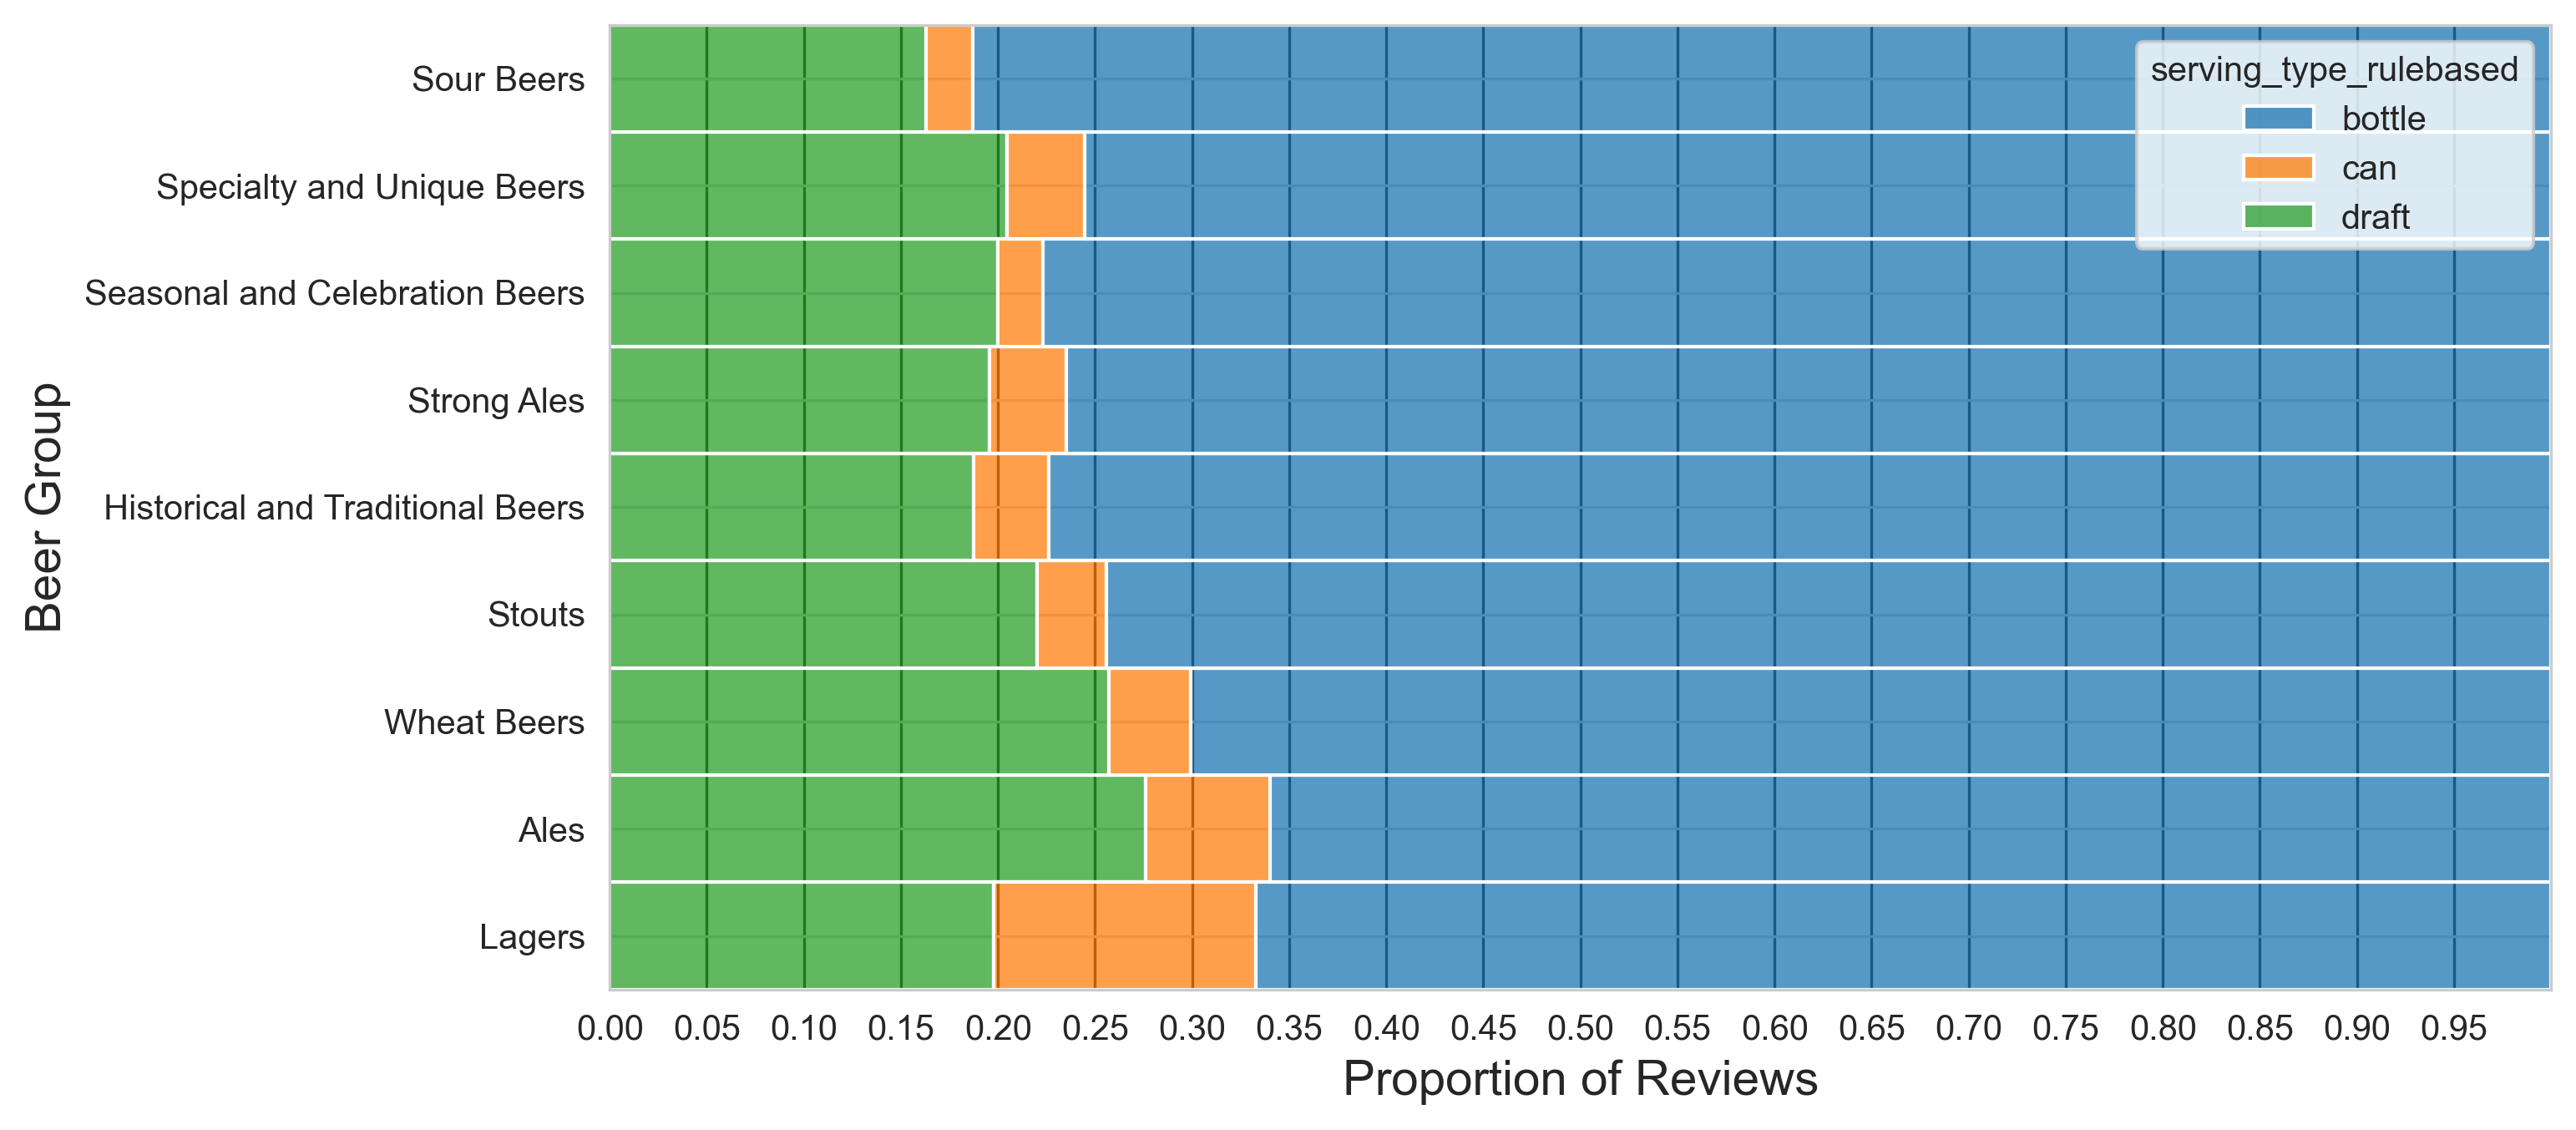
Here's a sneak peek into the beer landscape. Bottles are the regulars – no surprises. Cans? They fancy hanging out with Lagers. The misconception that canned means cheap? Lagers seem to be caught up in that story. No fuss, no frills – just the real beer deal. Cheers to clarity through the haze! 🍻
Statistical Analysis
Once we were confident with the extracted serving styles, it was time to analyze and try to answer our initial question! First, we looked at the distribution of the grades for each aspect of the tasting palette: aroma, palate, taste, appearance, and overall grade, for each serving style.
We see the distribution are different, but in summary, what is better ?
From the boxplots, we see that indeed the ratings are different between the serving styles! As expected, people prefer draft beers, and then bottles, and finally cans. Can still seem to suffer from the bad reputation of the 70s, when they were associated with cheap beers.
What about the other aspects ? Regarding the appearance of the beer, people really don't like cans! Is it because they don't see the beer, or because the beer is not as good ? Regarding the aroma, palate and taste, the ratings are even more different between the serving styles!
We threw our data into the statistical boxing ring, armed with t-tests, hoping to unveil the undisputed champions of beer ratings based on serving styles. Ding, ding, ding! The p-values came out swinging, all below 0.05, indicating a statistically significant difference in scores. But wait, our dataset had a bit of a size mismatch – lots of bottles, a fair number of drafts, and just a few cans. It was like comparing heavyweights to featherweights, so our new friend Kruskal-Wallis test stepped in to level the playing field. The p-values were still below 0.05, so we can conclude that the difference in ratings is not due to the serving style!
Hold your beer! We couldn't let the confounding suspects go unchecked. What about the beer style, the alcohol by volume, or the brewery? Time to play detective. We initiated a turn-around by filtering our data to examine beers served in all three styles – bottles, cans, and drafts.
We used beers that had at least 10 reviews in each beer style. The number 10 made sure the amount of reviews was significant but still enough different beers were detected.
The results unveiled a revelation – the difference in ratings isn't from serving style! It's only about the beer style, alcohol by volume, or the brewery. The serving style left center stage as we found that there is only a difference for 5 to 8% of those beers.
But wait, there's more! Could it be a tag team effort? Does the beer style and serving style influence the rating in tandem, for different beers? Time to go back to our initial dataset and unleash the ANOVA test! With the dramatic flair of statistical revelations, we found that indeed, the ratings danced to the tune of beer groups.
So, is it a harmonious blend of beer style and serving style, or are they dueling for the spotlight? The plot thickens, and our journey through the world of beer ratings continues! To check this, we will use a ordinary least square (OLS) regression model !
This plot is like a treasure map to flavor-town! Hold onto your beer mugs; we're diving into the fascinating world of beer preferences. Draft takes the crown, but hey, not always!
Ales steal the spotlight, ranging from pale ales to rich brown ales, delivering a symphony of flavors. Are they too complex for the serving style taste buds to decipher? The plot thickens!
But wait, Lagers, the unsung heroes or maybe the rebels? They're the light, crisp, and refreshing daredevils, designed for swift sipping, not for lingering enjoyment. It's a crisp finish but a swift exit. Sorry, Lagers, we love you, but not everyone is on board.
Now, enter the silky, smooth superheroes – Stouts! Creamy textures that transcend serving styles, earning applause across the beer spectrum. It's a unanimous win for the velvety goodness.
And here's the plot twist – sour beers! Drumroll, please. Bottles steal the limelight. Is it the quirky fermentation process or a secret pact between sour beers and bottles? We'll let you decide.
Conclusion
So, what's the verdict on the serving style saga? 🥁 After an in-depth exploration, it's clear that serving style waltzes with ratings. But wait, there's a twist in the tale! Once we unveil the secrets of beer groups, the differences in ratings start to blur. Turns out, the tasting palette remains almost identical across all serving styles. So, whether you fancy bottles, cans, or drafts, it's all about your unique flavor journey. Cheers to sipping with style and keep enjoying your beers!
For the curious minds craving more depth, imagine unraveling the mysteries of beer temperature during tasting or decoding the impact of storage conditions. The adventure doesn't end here; it's just the frothy beginning!